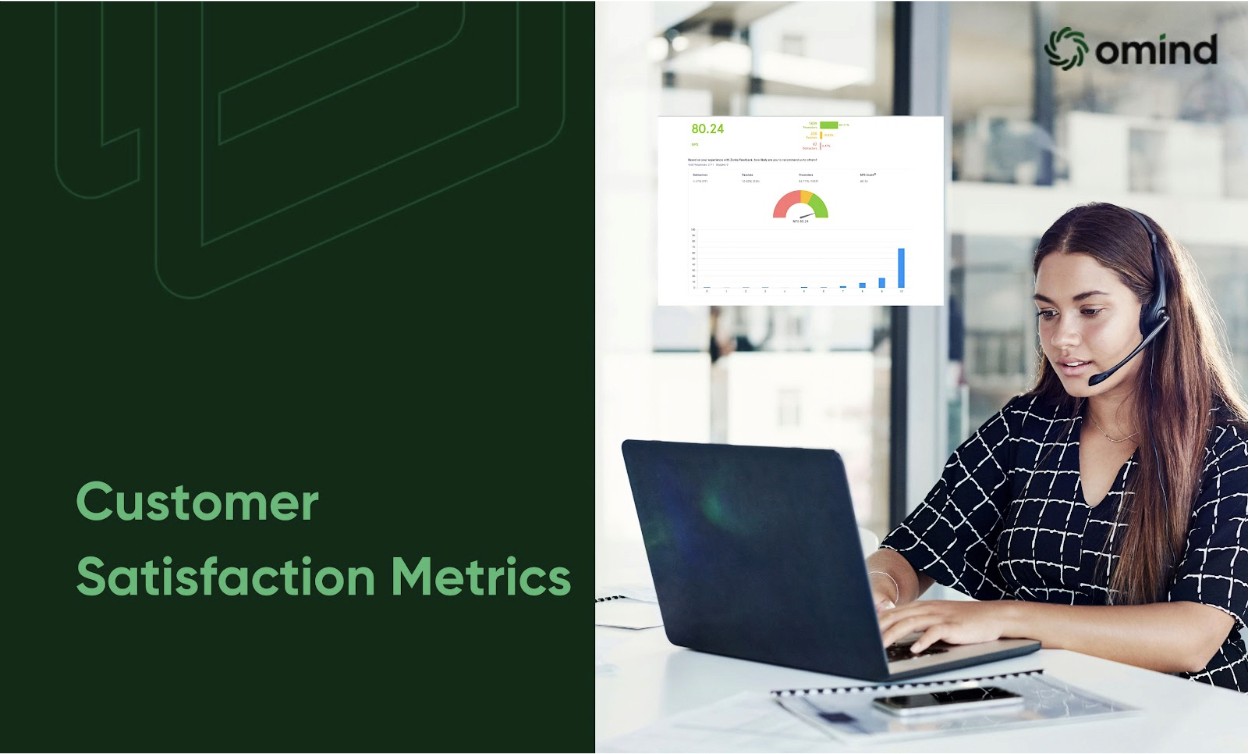
Knowing your customers' happiness is essential for any business in this competitive world. This is about understanding their needs and making informed decisions that drive success. In this article, we'll walk you through key client satisfaction metrics that are simple to measure and can provide valuable insights for a better decision. With these metrics, you'll better understand how well your business meets customer expectations. The goal is to identify and track the most critical satisfaction indicators so that a company can make necessary improvements to keep its clients returning.
Key Customer Satisfaction Metrics

Understanding your clients' satisfaction is more than just checking a box; it’s about building long-term relationships that drive business growth. Now, we’ll explore key client satisfaction metrics that are easy to measure and essential for keeping your customers happy and loyal.
Net Promoter Score (NPS)
What is NPS?
NPS (Net Promoter Score) checks customer loyalty and the likelihood that customers would recommend your business to others. It provides insights into customer sentiment, though it may not precisely reflect happiness. A business measures customer loyalty and satisfaction through this method.
Method to Measure NPS: To calculate NPS, ask your customers a simple question. Correct the question, "From 0 to 10, how likely are you to recommend this brand to others? This single question provides valuable insights into customer sentiment and how much they are satisfied with your product and service.
In the client satisfaction metric, the customers are categorized into three groups based on their score:
Promoters (9-10): These are your loyal clients who love your business. They are your biggest advocates and are ready to make repeat purchases.
Passives (7-8): They're satisfied but not enthusiastic, but they might stay with your business. They are also open to try your competitors.
Detractors (0-6): These customers are unhappy and might soon turn to your competitors. Identifying these groups early on can help prevent customer loss.
Benefits and Impacts
A high NPS indicates strong customer loyalty and increased sales and referrals. Assessing the NPS can identify areas for improvement and focus on turning detractors into promoters. Tracking NPS helps you measure the impact of changes in your business. You can streamline this process by leveraging advanced tools like Omind offers and gaining deeper insights into customer sentiments.
However, NPS isn't the only key player in customer satisfaction; let's explore another crucial metric, the Customer Satisfaction Score (CSAT).
Customer Satisfaction Score (CSAT)
CSAT stands for Customer Satisfaction Score. This type of metric measures customer satisfaction with a specific interaction or experience. CSAT is a great way to assess customer sentiment about your products, services, or support.
Measuring CSAT: Measuring this is straightforward. You have to ask customers to rate their satisfaction from 1 to 5 or 1 to 10 after a particular interaction. You usually do this shortly after a purchase, a support interaction, or using a product feature.
Methods to Measure CSAT: This can be measured at various touchpoints in the customer journey. Understand that this metric is essential to assess satisfaction after interactions like purchases, product usage, or marketing campaigns.
Benefits and Impacts: A good score on the CSAT can show that your clients are happy. So, now you have a strong group with loyalty who also become strong advocates for your brand. Not only that, but these trusted groups will do more business. CSAT identifies trends, measures the impact of changes, and tells you the areas for improvement. Omind's platform can automate this process, making gathering, analyzing, and acting on CSAT data easier without manual effort.
Now, let's explore how hard—or hopefully easy—it is for your customers to do business with you by looking at the Customer Effort Score (CES).
Customer Effort Score (CES)
The customer effort score (CES) metric helps you understand how easy it is for your clients to interact with your business. For instance, a customer raises an issue and how much effort customers put into resolving it, finding information, or completing a task. A low CES indicates a positive customer experience.
Measuring CES: Like CSAT, CES is mostly measured through a short survey after a customer interaction. It usually occurs after raising an issue or product return or sometimes when purchasing products or services.
The CES Question: The normal CES question you can expect is: "How easy was it to handle your issue today?" After that, you can ask them to rate their experience from 1 to 5 or 1 to 7, with 1 being very easy and 5 to 7 being very difficult.
Why CES Matters?
A lower CES score indicates a better customer experience, which is often associated with higher customer loyalty, increased purchase frequency, and positive advocacy. When businesses reduce customer effort, they can improve customer satisfaction and retention and increase revenue. The CES helps identify pain points in the customer journey and allows for targeted improvements.
Speaking of pain points, it's essential to keep an eye on how many customers you might be losing; that's where customer churn rate comes in.
Customer Churn Rate
Customer churn rate means the percentage of customers who stop doing business with a brand or company in a specific period. If you want to calculate the churn rate, divide the number of customers lost during a particular period by the total number at the beginning, then multiply by 100 to get a percentage.
Why Does Churn Rate Matter?
It matters as it affects your business. A high rate in this category indicates customer dissatisfaction, which can negatively impact revenue and growth. Understand why and take necessary action by solving what they want.
If a business wants to reduce this churn, it must improve customer satisfaction and loyalty. This means delivering exceptional customer experiences, addressing customer pain points, and providing excellent customer support, especially after the purchase. Personalized interactions help businesses build strong relationships and retain customers.
Let's examine the Customer Health Score (CHS) to get a fuller picture of your customers' real performance.
Customer Health Score (CHS)

The Customer Health Score (CHS) represents a customer's overall relationship with your business. This score will help you understand customer satisfaction and engagement. A higher CHS indicates that your company has stronger, healthier customer relationships.
How can you Measure Customer Health?
This client satisfaction metric is calculated based on various indicators of customer behavior. These may include product usage frequency, purchase history, support interactions, survey responses, and engagement with marketing materials. Giving weights to different indicators can create a comprehensive score.
CHS Categories
Customers are categorized based on their CHS into three groups:
Weak: Customers with low CHS are at risk of churning. They may be experiencing issues or dissatisfaction.
At-risk: This group has a moderate CHS, which means it is not immediately at risk. However, attention is required to prevent churn.
Healthy: Customers with high CHS are satisfied and engaged with your service. They, indeed, do not find your competitors and come for more.
When you analyze CHS, you gain valuable insights into clients' behavior. You can identify at-risk customers, address their concerns, and improve retention. Additionally, CHS helps you segment customers for targeted marketing and upselling efforts. Using Omind's platform can simplify categorizing and analyzing CHS, helping you take quick, effective actions to retain at-risk customers and further engage healthy ones.
Now that we know how healthy your customer relationships are let's discuss their long-term potential with Customer Lifetime Value (CLTV).
Customer Lifetime Value (CLTV)
Customer Lifetime Value (CLTV) is the predicted net profit from a customer's future relationship. It can be calculated by multiplying the average order value, purchase frequency, and customer lifespan.
Why CLTV Matters?
The client satisfaction metric, CLTV, is crucial for business growth as it helps you understand each customer's long-term value. By increasing CLTV, you can prioritize customer retention and loyalty over short-term gains.
To maximize CLTV, focus on building better customer relationships. Offer excellent customer service, personalized experiences, and loyalty programs. They will encourage repeat purchases through cross-selling and upselling. Additionally, invest in customer retention strategies to increase customer lifespan.
By leveraging Omind's generative AI-driven insights, you can tailor experiences that significantly boost CLTV, ensuring customers stay engaged and loyal over the long term.
Alright, we've covered the metrics; how about some practical tips to measure and boost your customer satisfaction even further?
Tips for Measuring and Improving Customer Satisfaction

Let's see some tips that will help you win your client’s heart.
Combine Approaches: Don't stick with a single customer satisfaction metric. Combine feedback methods like surveys and NPS with indirect measures like website traffic, sales data, and social media sentiment. A comprehensive approach like this may provide a holistic view of customer satisfaction.
Customer Feedback Tools: Use customer feedback tools like online surveys, feedback forms, and social listening in your strategy. These tools help you collect valuable insights directly from customers, analyze the feedback, and identify trends and areas for improvement.
Continuous Improvement: The journey of customer satisfaction metrics is never-ending. Continuously interact with clients through surveys, focus groups, or one-on-one conversations. Use feedback to make data-driven improvements to products, services, and customer experiences.
Leveraging Multiple Channels: Customers nowadays use diverse channels. Collect feedback from all touchpoints, including in-store, online, and mobile experiences. This helps you identify problems and opportunities for improvement across the entire customer journey.
Conclusion
Improving customer satisfaction metrics is crucial to business success. A company can gain valuable insights into customer behaviour and loyalty by tracking metrics like NPS, CSAT, CES, churn rate, CHS, and CLTV. These metrics help identify areas for improvement, make data-driven decisions, and improve customer satisfaction.
Are you looking for a partner to craft exceptional customer experiences? Choose Omind, an AI-driven platform that empowers you to measure, analyze, and improve customer satisfaction. With actionable insights, Omind helps you turn customer feedback into business growth. Schedule a demo now, and let's work together to offer an exceptional customer experience.
AUTHOR
Team Omind
Empowering Businesses with Unified Customer Experience Platform, Leveraging Advanced AI and Intelligent Automation
PRODUCT
QMS
Share LINK
Related Blogs


